Bizologie Buzz: What’s Trending in the VC/Startup Industry

Each week we round up a few interesting articles, reports and presentations that we believe are of particular interest in the VC/Startup Industry.

How to find a SWOT Analysis

magnifying-glass.jpg

We've talked before about Business Source Complete and how often we use it when doing business research. If you've been tasked with finding a SWOT analysis, BSC is your go-to resource. SWOT pic1First of all, what is a SWOT analysis? SWOT stands for Strengths, Weaknesses, Opportunities & Threats. Our friends over at Investopedia and Wikipedia have  more detailed definitions as well as some historical/background information if you're interested in the details. For now, we'll just focus on how to find one when someone asks.

Most likely, you'll have access to Business Source Complete through your local public library and you can usually sign in from home with your library card. Once you're on the BSC site, click on "advanced search". Over on the right in the browse column, you'll see "SWOT Analyses" listed near the bottom.

Once you've click through, you'll see an A to Z list of companies to browse as well as a search box to look for specific companies (public companies). I'll use Apple Computer as my example. I can see that there are SWOTs listed back to 2008, but I chose to check out the most recent which is from July 2014. The entire report is about 10 pages and includes not only the SWOT itself but also a company overview and some key facts such as revenue, number of employees, stock ticker, etc. There will be an extended description of each strength, weakness, opportunity and threat, as well as the traditional 2x2 matrix which you can see below.

Apple SWOT

Bizologie Buzz: What's Trending in the VC/Startup Industry

bizologie_b_facbook_180x180.png

Each week we round up a few interesting articles, reports and presentations that we believe are of particular interest in the VC/Startup Industry.

10 Reasons Your Business Needs a Librarian


  1. Librarians have a vast knowledge of subject-specific resources and can navigate directly to different sorts of data, rather than than having to fumble their way to it via a search engine.

2. Librarians have access to proprietary databases. While it may seem like you can “just Google it”, some of the best research isn’t available freely on the web. Licensed databases offer company profiles, market overviews and industry reports that aren’t available in other places.

3. Librarians Google better than anyone. Google indexes trillions of web pages. Trillions. You’ll need a professional searcher to make sure you don’t miss anything.

4. A librarian is the next best thing to a private investigator. Librarians can track down company email addresses, create executive profiles and assemble corporate timelines.

5. Because librarians are trained to do reference work, they are adept at helping users refine their queries, which enables them to provide those users with the most essential information.

6. Librarians don’t quit just because something is hard to find. They keep digging, asking questions and retooling search strategies until they discover something useful.

7. Librarians are part of a loyal, tight-knit network that stretches across international borders, and they make a habit of leaning on each other for information or expertise.

8. In addition to knowing how to find hard-to-find stuff, librarians are seasoned customer service professionals who know how to make the experience of asking for and receiving information a pleasant and rewarding one.

9. Librarians are cheaper than MBAs. The Average MBA Salary is $113,000 while the average librarian salary is $47,000 (Updated to note that the average Business Librarian salary is $56,000 according to Indeed and $70,000 according to the Special Library Association) Business Librarians have experience doing company, industry and financial research.  Pay the MBA for the analysis and leave the search for information to the librarian.

10. Librarians have superpowers.


Bizologie Favorite Tools: IPOScoop

IPOScoop-Logo.png

IPOScoop is a subscription service providing predictions for IPOs' performance on opening day. Founded by John E. Fitzgibbon Jr. in 2006, IPOScoop also has lots of useful, free information as well. The site has a running list of the most recent 100 IPOs. Initially sorted by date, you can also sort by return rates and industry. Additionally, each company listed links to a company profile showing the business description, number of employees, date founded, contact information and revenues. They've even got a link directly to the companies' SEC filings. You'll also find a great chart showing "IPOs priced in the last 12 months sorted by Industry":

IPO Scoop

You can also see upcoming IPOs and links out to their S-1s and a handy list of other helpful IPO links. We've added IPOScoop to our list of favorite resources. 

Bizologie, LLC to provide research services for investment firms and start-ups

bizologie_web_logo_tag.png

For Immediate Release: AUSTIN, Texas, June 2, 2014 – Bizologie, an independent research consultancy serving venture capital firms, private equity firms, start-ups and established companies, announced its formation today.

Founded by longtime Austin Ventures research analysts Laura Young and Michael Hill, Bizologie is the product of more than 20 years of combined business research, competitive intelligence and due diligence experience. A combination of deep industry knowledge and diverse backgrounds allows Bizologie to offer clients customized contract research services on everything from venture capital to social media to logistics to private equity to ecommerce to food & beverage to software-as-a-service and more.

While typical projects include market landscapes, industry contact lists, company and executive backgrounds, industry overviews and competitive intelligence data, Bizologie offers any number of other products and services and features a flexible pricing model that allows clients to contract with them on an annual basis or seek assistance with one-off projects. Bizologie’s current client roster includes Austin Ventures.

For more information, contact:

Laura Young ([email protected]) or Michael Hill ([email protected])

www.bizologie.com

Business Radio from the Wharton School

Wharton-Busines-Radio-Logo-Large.jpg

This week the University of Pennsylvania's Wharton School launched Business Radio on SiriusXM. They'll be broadcasting 24/7 from the Wharton Campus as well as Silicon Valley. Hosts will include professors and alumni and guests will feature executives, entrepreneurs, and innovators. Their programming looks interesting and promises to "cover every aspect of business in an informative, entertaining and approachable manner", while appealing to  listeners from all different experience levels from CEOs down to mom-and-pop store owners. A quick look at their programming looks really well-rounded from personal finance to women in the workplace to the goings-on in Silicon Valley. You can check them out on Channel 111 on SiriusXM and on Twitter @BizRadio111.

Gallup Healthways Well-Being Index

GallopHealthways.jpg

What U.S. city has the best work environment?  How have the happiness levels of the U.S. changed through “The Great Recession”? The Gallup Healthways Well-Being Index tries to answer these questions by daily surveying 1,000 people 7-days a week.  The assessment first started on January 2, 2008, and the project’s goal is to collect data for 25 years.  Currently, there are over 5 years of data—enough to start identify and evaluate trends.  The study is a collaboration between the polling firm Gallup and the healthcare solutions company, Healthways.

The Well-Being Index is an average of six major factors:

  • Life Evaluation—how a person compares their present situation to future situation
  • Physical Health—BMI, disease, six days, physical pain, etc.
  • Emotional Health—experiences of smiling, enjoyment anger, happiness
  • Healthy Behavior—lifestyle habits including
  • Work Environment—job satisfaction, supervisor’s impact, ability to use strengths
  • Basic Access—access to food, shelter, healthcare and a place to live

The homepage presents an overview of the indexes in a stock-chart type format.

The Findings tab provides much more detailed results including descriptions of trends, demographic breakdowns, and the highest and lowest performing cities.  Much of this data was summarized after the 1 millionth survey was completed in 2010, but the link for City, State and Congressional District Well-Being Reports contains summarized data from 2012.

The site has fine-grained data not found anywhere else and contains interesting visualizations, such as this image from the 2012 Composite Report showing composite well-being data by metro area:

Gallop Healthways Map

Charts and visualizations used on the site can sometimes over-emphasize differences.  The scales changes on each chart—and sometimes skip sections (such as on the “Daily Pulse” chart).  The chart below—the Emotional Health Index—only show 3 percentage points, so it looks like we’ve made a huge jump up since 2009.

Gallop Healthways Well-Being Index

However, since these surveys are representative of the entire united states, just a 1% increase or decrease means 3.1 million people.

Numbers from the Gallup Healthways Well-Being index are used by other Gallup Reports, such as this report on the number of uninsured in the U.S., and in major news sources.  Or you could use this data to help find a new city to live in!

P.S. Lincoln Nebraska was the top city for Work Environment in 2012 (and the city with the highest overall wellbeing), and levels of emotional well-being dipped during the end of 2008 and beginning of 2009, but have risen again almost to pre-recession levels.

Guest Blogger: Kari Beets is the Graduate Research Assistant for Business at the University of Texas Libraries. She completes her MSIS program at the UT Austin School of Information in May 2014.

Economic Indicators—By City

USCensus.jpg

I received a research question recently on comparing employee turnover in a specific industry between two cities.  After searching the BLS, Statista, Factiva and Business Source Complete (for any mention of data sources), I finally found a link from a Chamber of Commerce site to the Census Bureau’s Quarterly Workforce Indicators that provided the detail of information I was looking for. The Quarterly Workforce Indicators have been around since 2006 and are collected through a federal-state program known as the Local Employment Dynamic (LED) partnership.  Data points include number of employees in a given quarter, hires, separations (quits and fires), and monthly earnings.  These can be sorted by geography, industry, or worker demographics.

Quarterly Workforce Indicators can be accessed through QWI Online and the LED Extraction Tool.

QWI provides tabs and dropdowns to choose your specific characteristics.  To filter by a more specific industry, click on the “Information by Detailed Industry” link.  You can download the data into Excel one quarter (or industry) at a time.

The LED Data Extraction Tool is more user-friendly and allows you to choose the specific data for the report.  It allows you to include multiple cities, industries and indicators to export all at once.

However, when you export the data into Excel it is quite messy.

With a little data sorting, you can get a chart like this:

QWI  is a great resource for finding workforce trends at the local level!

Guest Blogger: Kari Beets is the Graduate Research Assistant for Business at the University of Texas Libraries. She completes her MSIS program at the UT Austin School of Information in May 2014.

Twitter Secret S1 Filing

Twitter.jpg

Twitter is going to IPO but why can't you find their SEC filing? Where could that pesky S-1 be hiding? Last year my colleague Ryan Field posted about the looming red herring shortage and his prediction has come to fruition. As Ryan reported, the Jumpstart Our Business Startups (JOBS) Act was signed into law in April 2012.  The law is designed to encourage entrepreneurship both by making it easier and safer to go public and by relaxing certain fundraising requirements imposed by the Securities and Exchange Commission (SEC).

Under the JOBS act, Emerging Growth Companies (EGCs are those that posted revenues of under $1 billion during their most recent fiscal year) are able to confidentially file drafts of their registration statement (S-1) for non-public review prior to their actual public filing.  An EGC’s S-1 is only made public 21 days before it conducts a roadshow.

Twitter is one of those EGCs so we know their revenue is under $1billion. Luckily, Twitter is expected to release the filing any day (maybe this week). Each S-1 filing contains unique information about each company but you can usually expect to see five years of financials, breakdown of revenues by type,  and other market research on the industry as a whole. Based on the Facebook S-1 we will probably see a lot of Twitter usage information too.

Watch your Twitter feed for exciting SEC news coming soon!

Aggressively and Passive-Aggressively Finding News You Need and Didn't Know You Needed

news-and-coffee1.jpg

Most of my job as a Research Analyst involves answering direct questions on specific topics. But I also try to provide information proactively on topics I believe folks in my firm would like to hear about even if they don't realize it. To do this, I've set up several ways to passively monitor news and reports that may be of interest. Sometimes I have general topics I keep track of like "startups" and "venture capital". But other times, reports and articles come out that don't fall within my keyword parameters, but are large industry primers on some hot topic or another. How can I find great reports that even I didn't know I needed? Below you'll find a few of my tactics for keeping track of  everything all while making it look effortless.

1. I use HootSuite to monitor keyword streams. This way, the rest of the world looks for articles so I don't have to:

2. I personalize my Google News page to cover specific companies and topics:

3. To find newly published primers on a variety of topics, I use the Google search string: 2013 primer filetype:pdf. You can obviously make this search as specific as you like, but here I'm just trying to see if I hit gold when I'm not really trying:

I'll also use this tactic for big year end/new year reports on hot topics like social media or big data: social media 2013 filetype:pdf:

4. I've also got access to a couple of paid databases at work, so once a week I'll run a search showing every report over 100 pages published in the last 7 days. Or using my "primer" keyword, I'll have databases alert me every time a report has the word primer in the title. It's a great way to find in depth reports and it doesn't take much time or effort on my part.

How do you keep up with your research? Let us know on Twitter @bizologie!

Casual Friday: Coffitivity

Coffitivity.png

I just moved into a new office at work and it is a little quiet. If I play music it can disrupt my neighbors and honestly it makes me want to dance and sing along. Not conducive to getting work done. So the solution, a little white noise. Not just any white noise though - sounds of the coffee shop. Now we can all get the sounds of a lively coffee shop in our own office with Coffitivity. Coffivity links to research showing that people are actually more creative if they have a little ambient noise in the background. This is a research site, so you've got to love a link to a Journal of Consumer Research article from JSTOR. Way to cite your sources Coffitivity and even give us a copy!

I've been using the site for a week now and I love it. There is an option to play your own music just slightly over the background noise, but I haven't tried it out. The ambient noise is just right for me.  I keep it low enough that it doesn't bother me when I"m on the phone or even when people are in my office, but it fills in the empty office.

Cycling for Libraries 2013 – Day 1

Cyc4Lib2013.jpg

Another Cycling for Libraries trip under my belt and this one was tough! The libraries were awesome but the weather was terrible. This year the Amsterdam to  Brussels route was shorter than last year but it was more difficult thanks to the rain and wind. The 2013 ride was made up of 120 librarians from 20+ countries. I saw many of the friends I made last year from the Baltics trip and made a ton of new friends. I had another amazing experience. Hope you will follow along with the diary, photos, and videos from the trip. The library visits actually started as soon as I landed in Amsterdam. Schiphol Airport has a library in the International terminal. It features travel books on the Netherlands and books by Dutch authors. It is actually the only place where you can download Dutch music for free. Great way for publishers to introduce Dutch works to a captive audience. The library has computers and a lot of comfortable seating since many travelers use this as a lounge and hang out for hours. I love how the art walls make it look like home.

Day 1 - Amsterdam The first day we met at the Open Bare Bibliotheek Amsterdam (OBA). What an incredible way to start off the trip. This is the largest public library in the Netherlands. It has 7 floors of open, creative, inviting space. The building contains a cafeteria, and a restaurant. There are 500 computers and 1000 seats for study.

The next stop was the Institute of Tropics Library - KIT. This gorgeous old library contains a collection of Holland's cultural heritage with the oldest book from 1652. The staff has digitized much of the collection and they also work with African countries to create open repositories. Unfortunately, as were hear too often, funding was cut completely and the library would soon close. At the end of the trip we learned the great news that funding had been restored and the library would remain intact. I can only hope that Cycling for Libraries will continue their advocacy for libraries and the importance of information in the everyday lives of citizens.

To end the day we had kick-off party sponsored by the University of Amsterdam. It was a wonderful way to send us off on this journey of discovery.

Day 1 Video

Cycling for Libraries: Reflections on Libraries in the Netherlands

amsterdam-library.png

Fellow librarian and honorary bizologist, Barbara Fullerton joined our own April Kessler for this year's Cycling for Libraries. Here are her thoughts and initial impressions of public libraries in the Netherlands:

  • Most are open from 10 am to 10 pm, 7 days a week!
  • Cafes, Cafes, Cafes. Very important in Netherlands libraries and I''m getting used to my lattes in the afternoon visits.
  • Libraries are in the center of town.
  • Libraries are membership based and charge a small annual fee.
  • Libraries are in train stations and airports. How about the unemployment office?
  • Public libraries have the same branding so they are visible to all.
  • Most libraries have a modern look.
  • OCLC is popular.
  • Biggest public library is in Amsterdam: www.oba.nl
The saddest item I heard this week: the closing of the Royal Tropic Institute. What will happen to this Special Library and its collection? There will be layoffs and, most shockingly, all materials will be shredded!! This is a huge impact that includes books, drawings, manuscripts, journals, valuable maps....anything in printed format, regardless of age. I hope the Dutch government will find the funding to keep this library open.
Below, you can checkout the video from Day 2:

Thank You to Cycling for Libraries Supporters

CYC4LIB_2013.png

Thank you to all the folks that helped us reach our fundraising goal for Cycling for Libraries! We start our trek from Amsterdam to Brussels on June 18. Watch for videos and a day by day recap of our adventures. We would like to thank our Library Associations TLA and SLA for helping us spread the word about the trip. And, we give a very special thank you to our generous donors:

Matt Lassila Rex C. Cindy Romaine C. Chidester
K. Parhizi Davewellbeloved mccranie3 Bridget Macmillan
Catherine Hardy Amanda Lefebvre Jill Strand Lola C.
Cynthia Shamel Yun Choi Coughlan Christine julup
Jane Whittlesey nscibellibouthilet Ronda Rowe Denise Chochrek
Gary Isenagle Colleen Cable Maria Bagshaw Joan Englander
Ann Koopman Colleen Lyon Georgia Pribanic Robert Bolton
Tracy Timmons Debra Kolah Tony Saadat DALL
Anonymous donors Librarians at TLA

Thank all of you again for helping us take this amazing international library adventure! --Barbara Fullerton, Karen Holt, & April Kessler

Casual Friday: Secret Country

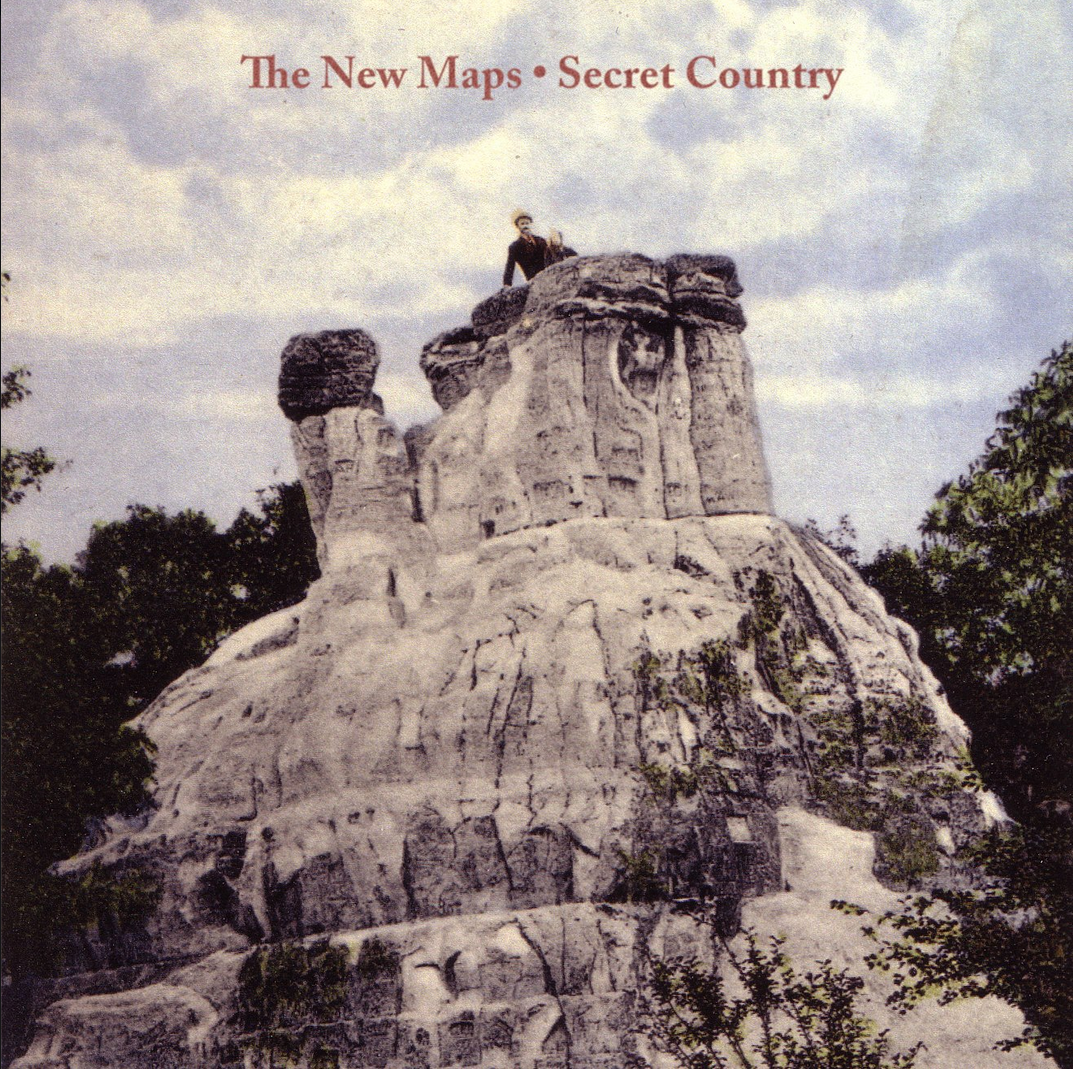
new-maps-album.png

Librarian-gone-rogue/business researcher Michael Hill and his Austin-based band The New Maps (last chronicled in these pages in February 2012) are back to their off-the-clock ways with a new album for 2013. Titled "Secret Country," it features 9 new original songs by Hill and a wistful, atmospheric cover of Mark Kozelek’s Red House Painters gem “Have You Forgotten.” Built on a foundation of guitar-and-drums-forward sonics and sturdy, power-roots-pop songcraft, “Secret Country” is largely a product of core members Hill (vocals, guitars, bass, keyboards, percussion) and Jeff Olson (drums, vibraphone), but one that also features contributions from cellist Dylan Rieck (Balmorhea) and pedal steel guitarist Phil Ajjarapu. Founded in 2011, The New Maps released their full-length debut “These Parts” in 2012. Original bassist Paul Grotevant exited the band later that year, but Dusty Rhodes (Mother Falcon, Sahara Smith) has since stepped in to fill that gap admirably. Now, with a new recording, a new member and new energy driving them, The New Maps are poised to keep pushing their musical boundaries - not to mention shattering a librarian stereotype or two - as they take listeners through the "Secret Country" and beyond. The album is available on iTunes and the title song may be streamed on the band's Facebook page .

50 Apps in 50 Minutes Redux

50-apps-redux.png

Last year at the Texas Library Association's Annual Conference, we presented  50 Apps in 50 Minutes. Lucky for us, the presentation was a hit and they've asked us back this year.  Below you'll find our new presentation "50 Apps in 50 Minutes Redux".  A note on pricing and availability: it’s been our experience that prices for apps change often, so if you like something that’s a bit out of your budget, keep an eye on it as sometimes the prices drop temporarily or even permanently. Love something that’s only an iThing? We saw several notes along the way indicating that an app’s owner listed Android, etc. as “coming soon”. So make a note of what you like and you may see it soon on other platforms. 1. iNextBus "Ever wonder when will the next bus arrive and which bus route to choose? Do you prefer waiting it at the stop or a snug coffee shop nearby? With this Next Bus app you can visually pin-point the location of every incoming buses on map as well as an accurate estimate of arrival time." Free for iPhone & Android

2. Tagg Tracker GPS tracker for lost pets. $100 for GPS device, $7.95 Monthly Service, Android & iPhone

3. Waze "Waze is the world's fastest-growing community-based traffic and navigation app. Join other drivers in your area who share real-time traffic and road info, saving everyone time and gas money on their daily commute." Free for iPhone & Android

4. BookBoard for iPad A storybook app for kids. What we like about this one is that the company employs a children's librarian who helps with their collection, metadata and reading level assessment. Subscription based

5. SmartPark Parking app that includes altitude data for finding your car in a parking garage. Free for Android

6. Remind101 A safe way for teachers to message their class while keeping everyone's cell numbers hidden. Free as a website or an app

7. Winston Reads a daily synopsis of news from your social media networks, headlines weather, etc. Free for iPad, iPhone with Android coming soon

8. TouchSurgery Tool for medical students learning surgery techniques. Free for iPad & iPhone

9. Reading Rainbow LeVar Burton's new app recreating his famous television show. Subscription based for iPad

10. SunRise Combines your calendars from email and social networks. Free for iPhone

11. ProxToMe Send files from your phone to everyone within 250 feet without needing contact information. Great for transferring a presentation. Free for iPhone & iPad

12. SwiftKey Keyboard allows you to type without lifting your finger, predicts phrasing. $3.99 for Android.  13. Fleksy is free similar for iPhone.

14. Puzzle Alarm Alarm clock which has you complete a puzzle or equation to turn it off. Free for Android

15. Avast! Mobile Security Virus and theft protection. Free for Android. Lookout is similar for iPhone and is also free.

16. AppGarden Several utility apps (calculator, dictionary, area codes, etc) all in one. Free for Android

17. History Eraser Clears for calls, browser searches, texts, etc. Free for Android

18. SnapSeed Photo app that allows photo shopping. Free for iPhone, iPad & Android

19. JuiceDefender Monitors your apps to conserve battery life. Both a free and paid version

20. Pulse News aggregator which lets you import your Google Reader feeds. Free for iPad, iPhone and Android

21. PicStitch Photo app for collages. Free for iPhone

22. iOnRoad Personal driving assistant with dashboard camera. $4.99 for iPhone and Android

23. Yahoo! Weather App Combines Flickr photos with weather information. Free for iPhone

24. Fanhattan Search all your video apps (Netflix, Hulu, HBO, etc) in one place. Free for iPad & iPhone

25. Appreciate App rating tool. Free for Android, coming soon for iPhone

26. Pocket Save articles, videos and images for later viewing with no internet required. Free for iPad, iPhone & Android

27. Poetry Foundation App Search poems by category, share on social network sites. Free for iPhone & Android

28. Oscars View Oscar history, behind the scenes footage, and compare your ballot with friends. Free for iPad, iPhone & Android

29. Geocaching Find geocaching sites in your area. $9.99 for iPhone, Android & Windows Phone

30. Twitter Music New app for discovering music through Twitter. Connect with Spotify or rdio to listen. Free for iPhone

31. Vine 6 Second looping video app from Twitter. Free for iPhone & iPad

32. Prismatic News aggregator for iPhone & iPad

33. AllTrails Find hiking and skiing trails by location, difficulty and length. Free for iPhone, iPad & Android

34. Glasses.com 3D Fit Takes a 3D image of your head and then allows you to virtually try on glasses and compare. Coming soon for iPad with Android to follow

35. Storify Built a story board with articles, videos and images from multiple sources. Free for iPad

36. iTunes Movie Trailer View movie trailers by calendar date, find theaters, etc. Free for iPad & iPhone

37. Martha Stewart Cookies Cookie recipes, shopping lists, social network sharing. $3.99 for iPad & iPhone

38. Kings & Queens by David Starkey British Royal history, royal wedding footage. $2.99 for iPad & iPhone

39. Dr. Seuss Bookshelf Holds all of your Dr. Seuss books, games in one place. Bookshelf is free, with most inapps paid. iPad & iPhone

40. HealthTap Ask medical questions from a team of 36,000 doctors. Free for iPhone & iPad

41. Starbucks Pay with you app, but they also have a new feature called "Pick of the Week" which gives away free items in the store such as apps, music or NYT articles. Free for iPhone & Android though currently, only iPhone has "Pick of the Week"

42. Wanderable Chip in on the happy couple's honeymoon. Couple can send easy thank you notes. Free app and website, and Wanderable takes 5% of the amount.

43. Asthmapolis "Experts recommend that people with asthma track their symptoms, triggers and use of asthma medications. The Asthmapolis sensor and mobile application can help you learn more about and better manage your asthma." Cost TBD, possible insurance coverage

44. Yahoo! Mail for iPad New nicely designed mail app. Free for iPad

45. Rand McNally Road Atlas Digital version of an old favorite. Nice for road trips as it doesn't require an internet connection. $4.99 for iPad

46. SnapChat "Snapchat is a new way to share moments with friends. Snap an ugly selfie or a video, add a caption, and send it to a friend (or maybe a few). They'll receive it, laugh, and then the snap disappears." Free for iPhone & Android

47. The Particles Channel your inner Sheldon Cooper and learn a bit of physics. iPad & Windows 8 ~$7

48. Concert Vault "In 2003, Wolfgang’s Vault acquired master recordings from the archives of Bill Graham Presents. These live concerts were recorded at legendary venues like the Fillmore East and Winterland between 1965 and 1999. Since then we’ve acquired over a dozen more collections - some large, some small, all of them compelling, spanning a wide spectrum of musical genres." $3.99 a month for iPad, iPhone & Android.

49. LOCALSQR Find farmers markets in your area. Free for iPhone

50. Mango Tracks prescriptions and vitamins with reminders and records. Free for iPhone with Android Coming Soon.
SEC Goes Social

SEC.png

Here at bizologie we've always been proponents of using social media for business research. This is usually how we find information on private companies, first hand customer service practices, and employee history. But now it is even more important to keep an eye on all your favorite social sites because the SEC has approved social media as an outlet for public company announcements. Back in December Netflix CEO Reed Hastings came under investigation by the SEC because of a Facebook post back in July when he mentioned that Netflix viewers had just surpassed over 1 billion hours of streaming content per month. The information about the growing hours had also appeared on the company's blog, but no official press releases came out nor did Netflix file any forms with the SEC.

The SEC saw the writing on the (online) wall and decided that they could not fight the wave of social media any longer. No action was taken against Netflix or Hastings and the SEC made it clear in a report last week that companies can release information on social media sites. The social announcements are in compliance with Regulation Fair Disclosure (Regulation FD) if the company makes it well known where investors can find the information and it has to be accessible to all.

Not everyone thinks this is a great idea though. Check out Jon Friedman's viewpoint on The Montley Fool.

Good or bad, more information is going to be out there in more places. You should definitely consider a tool like HootSuite to help you manage all the social news.

Cycling for Libraries 2013 - Amsterdam to Brussels

Cyc4Lib_Logo.png

This summer Barbara Fullerton , Karen Holt, and April Kessler will embark on an international library adventure with Cycling For Libraries. This unconference offers a week of library workshops, debates, and tours with a diverse group of 100 international librarians from 22 countries cycling 250+ miles from Amsterdam to Brussels. Cycling for libraries is an international cycling conference that aims to advocate for libraries and increase awareness of the valuable services and resources that libraries offer to the community.

We could use your help

Your donation can help us cover registration fees which include room and board, bike rental, and travel expenses. Every little bit helps and we appreciate anything you can donate.

To Donate: http://www.indiegogo.com/projects/cycling-for-libraries-travel-funding

Expenses:

  • Registration - $325 per person
  • Bike Rental - $100 per person
  • Flight - $1500 per person

Other Ways You Can Help

Even if you can't donate, you can still help by spreading the word about our campaign. Thank you for helping us take this amazing adventure for libraries!

AND, if you are attending the TXLA annual meeting in Ft. Worth on April 24th-27th, visit our Booth #1013 in the Exhibit Hall!

A bit about us

Barbara Fullerton has been in the information professional field for over 15 years, with experience in vendor relations, and corporate and law libraries. She has a Master's in Library and Information Science from Emporia State University in Kansas. Barbara is an active member in DALL, SLA, President of the Texas SLA Chapter, and is currently on the Advisory Board of UNT's College of Information.

Karen Holt is the the founder and Editor-in-Chief of Librarian Lifestyle. She works as the Technical Services Librarian at Northwestern University in Qatar. Before moving to the Middle East Karen worked as the Communication Librarian at the University of Texas at Austin where she was the subject specialist for advertising, journalism, radio-television-film, and communication studies.

April Kessler is the Business Librarian at the University of Texas at Austin.She received her MSIS from UT and her MBA from Wichita State University. April is the Past President the Texas Chapter of the Special Libraries Association and serves on the Executive Board of the Texas Library Association. She is also the co-founder of bizologie .

Will Do Research For Beer

beer-institute-logo.png

We won't help you move for  beer but we will help you with your beer research. Just released this week, the "Beer Serves America" report, put together by the Beer Institute and the National Beer Wholesalers Association, takes a look at the economic impact of beer. According to the report,  "the beer industry employs more than 2 million Americans, providing nearly $79 billion in wages and benefits. The industry pays over $49 billion in business, personal and consumption taxes."  They've got great infographics on their page that allow you to see the economic impact of beer by state and even by congressional district. You'll also find several reports & presentations, as well as 2012 edition of the "Brewers Almanac"  which includes "production, tax-paid withdrawals, tax collections, consumption (total, state-by-state and per capita), agricultural statistics, imports, exports, financial statistics, employment, excise tax rates and methods of collection, and draft/package trends." And you can save your money for happy hour as all of this information is free!